
AI lead scoring models help sales teams prioritize leads by predicting which prospects are most likely to convert into customers. However, these models often inherit biases from historical data, leading to unfair or inaccurate predictions. Bias can harm business outcomes, reduce trust in the tool, and even result in legal risks due to emerging regulations like the EU AI Act (effective August 2, 2026).
Key Points:
- Sources of Bias: Data imbalance, proxy variables (e.g., zip codes), and historical sales preferences often skew results.
- Business Impact: Biased models waste sales resources, overlook valuable leads, and risk regulatory fines of up to €35 million or 7% of global revenue.
- Detection Methods: Audit training data, measure performance across groups, and use tools like SHAP or IBM AI Fairness 360 to evaluate model logic.
- Solutions: Improve training data quality, refine features, and monitor models regularly to minimize bias over time.
Tackling bias ensures better lead prioritization, protects against compliance risks, and fosters trust in AI-driven systems.
AI Bias Testing for Beginners: Where to Start?
sbb-itb-0ae5139
Common Bias Patterns in AI Lead Scoring
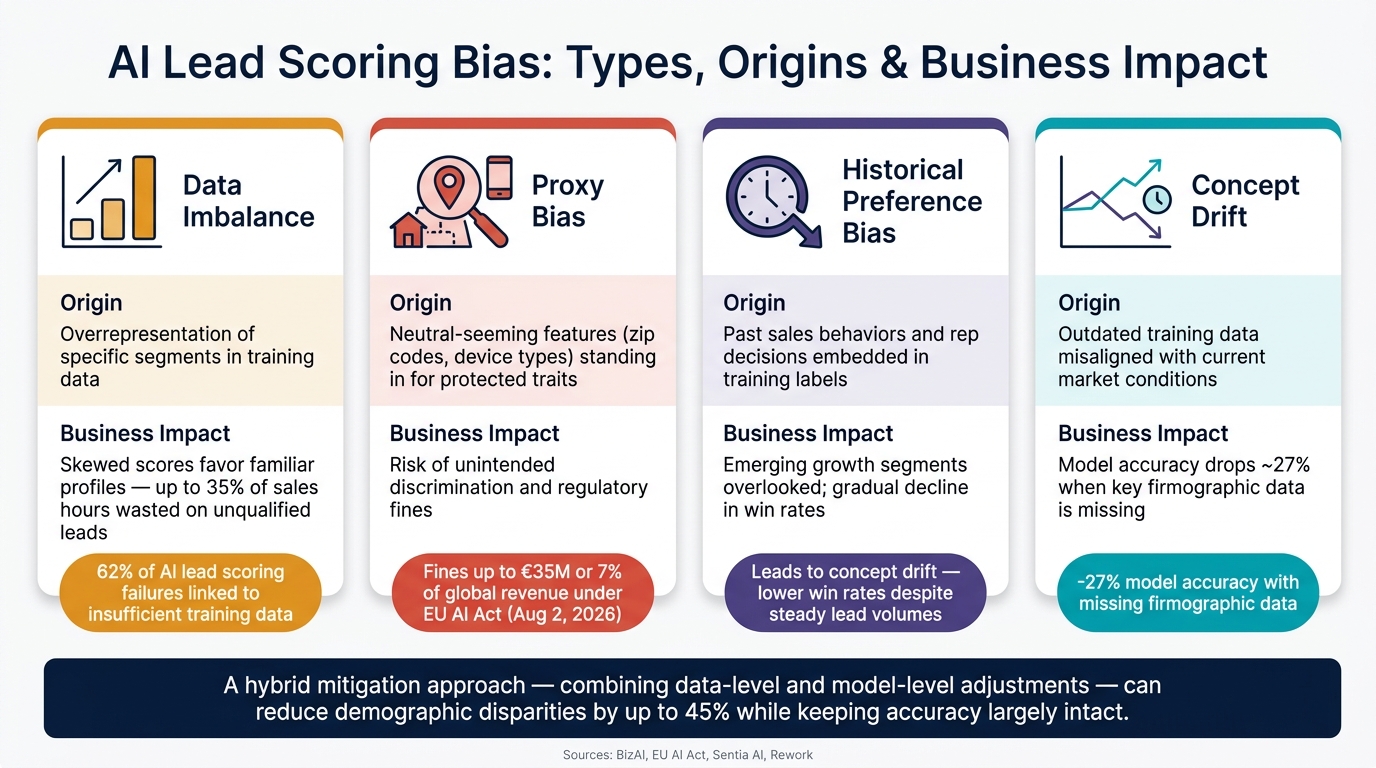
AI Lead Scoring Bias: Types, Origins & Business Impact
Data Imbalance and Representation Problems
One major source of bias in AI lead scoring is data imbalance. For instance, if 80% of closed-won deals come from mid-market SaaS companies in the Northeast, the model is likely to favor similar leads simply because it lacks enough data from other segments.
This imbalance can have serious effects. Studies indicate that 62% of AI lead scoring failures are linked to insufficient training data [10]. Worse, when key firmographic data is missing, model accuracy can drop by around 27% [7]. These flawed systems can waste up to 35% of sales hours chasing unqualified leads [10], creating a productivity drain that snowballs over time.
"Mistakes in AI lead scoring aren’t just technical glitches – they’re systemic failures that erode trust in AI systems." – BizAI [10]
Another subtle issue is the implicit feature problem. For example, models might combine fields like "creation time" and "last seen" to estimate how long a lead has existed. This can unfairly favor older leads with richer histories while penalizing newer ones that lack those signals [7][9]. Detecting this kind of bias requires a close look at how time-based features influence scores.
Proxy Variables for Sensitive Attributes
Even when sensitive attributes like race or gender are excluded, fairness isn’t guaranteed. Features such as zip codes, phone area codes, or company size can act as proxies for protected traits, introducing what’s known as proxy bias. This can lead to discriminatory outcomes, even if no one intended it.
"If your AI rejects a high-value lead or deep-discounts a deal without a clear, auditable reason, your organization isn’t just losing revenue; it’s inviting a regulatory audit." – Matt Small, Client Experience Engineer, Sentia AI [6]
The stakes are high. Under the EU AI Act, which becomes enforceable on August 2, 2026, certain automated scoring systems will fall under the "high-risk" category. Violations could result in fines of up to €35 million or 7% of global annual revenue [3]. In the U.S., agencies like the FTC and EEOC are also scrutinizing algorithms for potential discrimination. Identifying and addressing proxy variables is critical – not just for fairness, but also for avoiding penalties.
Historical Preference Bias
AI models don’t just learn from data – they also absorb the decisions that shaped that data. If historical sales activity reflects biases, like consistently deprioritizing leads from certain industries or regions, the model will treat those patterns as valid and perpetuate them.
"If your lead scoring model was trained on historical sales data that reflects past biases in how reps pursued different segments, that’s a data quality issue you need to address." – Victor Hoang, Co-Founder & CMO, Rework [3]
This bias can lead to "concept drift", where models trained on outdated data fail to adapt to new business strategies. The result? A gradual decline in win rates, even if the volume of leads remains steady [7]. Auditing training labels for these historical biases is a vital step in maintaining model relevance.
| Bias Type | Origin | Business Impact |
|---|---|---|
| Data Imbalance | Overrepresentation of specific segments in training data | Skewed scores that favor familiar profiles, leaving viable leads untapped [7] |
| Proxy Bias | Neutral-seeming features standing in for protected traits | Risk of regulatory fines and unintended discrimination [3][6] |
| Historical Preference Bias | Past sales behaviors embedded in training labels | Emerging growth segments overlooked by the model [7] |
| Concept Drift | Outdated training data misaligned with current market conditions | Lower win rates despite steady lead volumes [7] |
Spotting these bias patterns is a crucial first step toward developing strategies to address them effectively.
How to Detect Bias in AI Lead Scoring Models
Identifying bias patterns is just the beginning. The real challenge lies in creating a structured process to uncover and address these issues within your system. Here’s how your team can systematically detect and mitigate biases in AI lead scoring models.
Set Clear Fairness Objectives
Start by defining what fairness means for your model. You might use frameworks like demographic parity (ensuring similar high-score rates across all groups) or equal opportunity (ensuring qualified leads are identified at the same rate across segments). The choice should align with your model’s specific purpose.
One practical guideline is the 80% rule: if one group receives positive scores at less than 80% of the rate of the best-performing group, it signals a potential problem worth investigating [15]. Document this threshold upfront in a "model card", which should also include the model’s purpose, training data sources, and known limitations. This documentation provides clarity and serves as an audit trail [8].
Once you’ve defined fairness metrics, take a close look at your data’s makeup and the quality of its labeling.
Audit Training Data and Labels
With fairness objectives in place, the next step is to examine the data that trained your model. Start with a distribution analysis: break down the data by factors like industry, geography, or account size. Pay attention to groups that make up less than 5% of the data – these may need further review or even oversampling [13].
The quality of your labels is just as important as the volume of your data. As Sarla Consulting points out, "The bias comes from historical CRM data shaped by human decisions, some of which may themselves have been biased" [8]. Review CRM notes and interview sales reps to uncover subtle biases that raw data might not reveal [11].
Also, watch for proxy bias. Features such as zip codes, device types, or browsing histories can sometimes act as stand-ins for protected attributes. If a neutral feature has a correlation above 0.5 with a protected attribute, treat it as a high-priority issue to address before training your model [16].
Measure Model Performance Across Segments
After defining fairness goals and auditing your data, assess how the model performs across different groups. Aggregate metrics like accuracy or F1 scores might look fine overall but can mask disparities within specific segments [12]. To uncover these gaps, conduct a disaggregated evaluation, which breaks down performance metrics by group.
Here are some key fairness metrics to consider:
| Metric | What It Measures |
|---|---|
| Demographic Parity | Whether positive score rates are consistent across groups [13][14] |
| Equal Opportunity | Whether qualified leads are identified at the same rate across groups [15] |
| Equalized Odds | Whether false positive and false negative rates are balanced across groups [15] |
| Disparate Impact Ratio | Compares positive outcomes between disadvantaged and advantaged groups; below 0.8 indicates potential bias [14] |
| False Positive Rate | Tracks high-scoring leads that are frequently rejected, which could signal misweighted features [11] |
To better understand your model’s internal logic, tools like SHAP (SHapley Additive exPlanations) and LIME can highlight how each variable contributes to a score [6]. Additionally, open-source tools like IBM AI Fairness 360, Microsoft Fairlearn, and Google’s What-If Tool can help automate much of this analysis [12][14].
Matt Small, Client Experience Engineer at Sentia AI, sums up the importance of transparency well:
"When a sales rep understands why an AI rejected a lead, they stop fighting the system and start trusting the data" [6].
Ways to Reduce Bias and Build Fairer Lead Scoring
Identifying bias is just the first step. To ensure fair lead scoring models, it’s essential to take deliberate actions to address and correct it. Detection without action won’t lead to meaningful change.
Improve the Quality of Training Data
Start by enhancing your training data. Two effective methods to achieve this are:
- Stratified sampling: This ensures that underrepresented groups are included in proportion, preventing skewed results.
- Time-aware sampling: This avoids teaching the model outdated patterns that no longer align with current market trends [17].
Cleaning and normalizing your data is equally important. For example, standardizing job titles into seniority levels like C-Level, VP, Director, and Manager reduces confusion and ensures similar roles are treated consistently [19].
Pay attention to field completeness. Features with less than 70–85% completeness often add noise rather than value. Such fields should either be enriched or removed [18].
Don’t forget to include negative signals. If your training data only contains leads that converted, the model won’t learn to recognize disengagement. By adding data points like trial abandonment, unsubscribes, or inactivity lasting over 90 days, you can help the model avoid overvaluing leads that initially seemed promising but lacked real intent [18][2].
Tools like CRM Copilot.AI can assist by verifying and enriching data in real-time, helping you maintain the data quality needed for fair modeling.
Once your data is in good shape, it’s time to refine the features the model relies on.
Refine Model Features and Scoring Logic
After cleaning your data, take a closer look at the features your model uses. Begin by auditing for proxy variables – attributes that might seem neutral but indirectly reflect sensitive characteristics. For instance, zip codes or device types could act as stand-ins for protected attributes. If you identify such proxies, remove or replace them before retraining the model.
Another approach is feature whitelisting. This means restricting the model to a pre-approved set of attributes that have been vetted for fairness [4].
For teams ready to tackle bias at a deeper level, adversarial debiasing can be a game-changer. This technique penalizes the model during training for patterns that correlate with protected classes. While it may slightly reduce overall accuracy (by about 2–5%), it can improve fairness across groups by 10–15% [5].
Additionally, implement a "kill switch" to pause automated workflows if the model’s confidence score drops below 70% [6].
Even with these refinements, ongoing oversight is critical to keep the model aligned with evolving conditions.
Monitor and Update Scoring Models Over Time
No matter how well-designed, models will drift over time as buyer behaviors, market trends, and data quality shift.
"The model you build today will start decaying the moment you deploy it. That is not a failure of the model. It is the nature of a business that changes over time." – Jeff Ignacio, RevOps Leader [1]
To stay ahead, establish a regular monitoring routine:
| Frequency | Action |
|---|---|
| Weekly | Check for unexpected clustering in score distributions. |
| Monthly | Compare predictions to actual outcomes to review hit rates. |
| Quarterly | Perform a comprehensive analysis of the model’s performance across different segments. |
In addition to these scheduled reviews, gather qualitative insights directly from sales teams. For instance, use CRM disposition fields to capture why certain leads were rejected. This feedback can reveal trends that raw numbers might overlook [11].
Consistent monitoring can significantly improve lead generation ROI – by as much as 70% [11].
Finally, treat your datasets like software code. Use semantic versioning (e.g., MAJOR.MINOR.PATCH) to track every prediction back to the exact data snapshot that created it [17]. This not only ensures transparency but also simplifies internal audits and regulatory compliance.
Conclusion: Building Fair AI-Driven Sales Operations
Creating a fair AI-driven approach is crucial for ensuring sustainable and responsible sales operations. Bias in AI lead scoring isn’t just a technical issue – it carries business and legal risks too. Regulatory bodies like the FTC and EEOC have made it clear that organizations are accountable for biased outcomes, even when the bias is unintended [8].
Key Takeaways
To achieve fair lead scoring, focusing on data quality, model transparency, and continuous oversight is essential. Bias often originates from historical data, so addressing it requires a combination of strategies. A hybrid mitigation approach – combining adjustments at both the data and model levels – can reduce demographic disparities by up to 45% while keeping accuracy largely intact [20].
Explainability is another critical factor. When sales reps understand why a lead is scored a certain way, they are more likely to trust the system and use it effectively. This understanding leads to smarter pipeline decisions and better overall outcomes.
These principles provide a solid framework for embedding fairness into every aspect of your lead scoring process.
How CRM Copilot.AI Supports Fair Lead Scoring
Accurate and unbiased scoring starts with clean, reliable data. CRM Copilot.AI enhances fairness in lead scoring by focusing on real-time data verification and enrichment. This reduces the risk of incomplete or outdated records, which are common culprits for bias in training datasets. Its automated CRM workflows integrate seamlessly with tools like Salesforce, Zoho, and HubSpot, keeping your lead data accurate and consistent without burdening your team with manual updates.
"Responsible AI deployment in CRM is no longer just about avoiding reputational damage. It is now directly connected to regulatory compliance, customer trust, and long-term business scalability." – Sarla Consulting [8]
FAQs
How can I tell if my lead scoring model is biased?
To spot bias in your model, start by auditing lead scores against actual sales outcomes. Break down leads into score tiers and see if those with higher scores consistently result in conversions. This can help uncover any inconsistencies in how the model predicts success.
Next, dive into your CRM data. Look for patterns that might suggest certain groups are being excluded unfairly. Pay close attention to the features your model relies on – are any of them potentially introducing bias? Also, make sure your training data covers a wide range of scenarios and is representative of your target audience.
Finally, keep an eye on key metrics. Regularly monitor for false positives and any performance gaps across different groups. This ongoing tracking helps ensure your model remains both fair and accurate over time.
What fairness metric should I use for lead scoring?
Choosing the right fairness metric for CRM Copilot.AI lead scoring depends heavily on your specific context. Factors like applicable regulations, the impact of the model, and the trade-offs you’re willing to make all play a role.
Some commonly used fairness metrics include:
- Demographic Parity: Ensures equal selection rates across different groups.
- Equal Opportunity: Focuses on maintaining equal true positive rates among groups.
However, there’s no universal metric that works for every situation. To get a clearer picture, it’s a good idea to use disaggregated metrics to examine outcomes for each group. Additionally, tools like SHAP can help explain how specific features contribute to disparities, offering deeper insights into potential biases.
Which lead scoring fields are common proxy variables?
When it comes to lead scoring, businesses often rely on firmographic and demographic data to assess potential customers. These include details like:
- Company size
- Industry
- Revenue
- Location
- Job title
- Seniority
- Department
These factors are great for identifying who could buy, but they don’t always reveal who is ready to buy. That’s where tools like CRM Copilot.AI come in. By organizing and analyzing these data points, it helps sales teams prioritize leads more effectively and streamline their outreach efforts.