Predictive scoring helps sales teams make more money from the same lead flow by telling reps who to call first. In the article, the main pattern is simple: teams that rank leads by likely conversion can lift conversion rates, cut wasted rep time, shorten sales cycles, and lower cost per deal.
If I boil the full piece down, here’s what matters most:
- ROI comes from focus. Reps stop treating every lead the same.
- The math is clear. ROI = ((Revenue Gain − Total Cost) / Total Cost) × 100%.
- Costs must include everything. Software, data, setup, training, model work, and team time.
- The starting point is your CRM baseline. Use 6 to 12 months of data.
- Data quality drives score quality. Missing CRM fields can hurt model accuracy by 27%.
- Fast follow-up changes results. A lead contacted within 5 minutes can convert at a much higher rate than one contacted after 30 minutes.
- You need action, not just scores. Routing, alerts, nurture paths, and SLA rules turn scores into revenue.
- You need review cycles. Weekly checks, monthly threshold reviews, and quarterly retraining keep the model useful.
A few numbers from the article stand out:
- Conversion rates moved from 20% to 31%
- Revenue went up 55% at the same lead volume
- Lead-to-opportunity rates were 38% higher than rules-based scoring
- Rep capacity increased by 25%
- Sales cycle length dropped from 60 days to 42 days
Here’s the big takeaway: predictive scoring does not improve ROI by itself. Changed rep behavior does. The score only works when your team trusts it, acts on it, and works from clean CRM data.
The rest of the article explains how to measure that lift, set up the scoring model in your CRM, and track whether it keeps paying off over time.
Predictive Lead Scoring: Know Which Leads Convert Before You Follow Up
sbb-itb-0ae5139
How Predictive Scoring Increases Revenue and Cuts Sales Waste
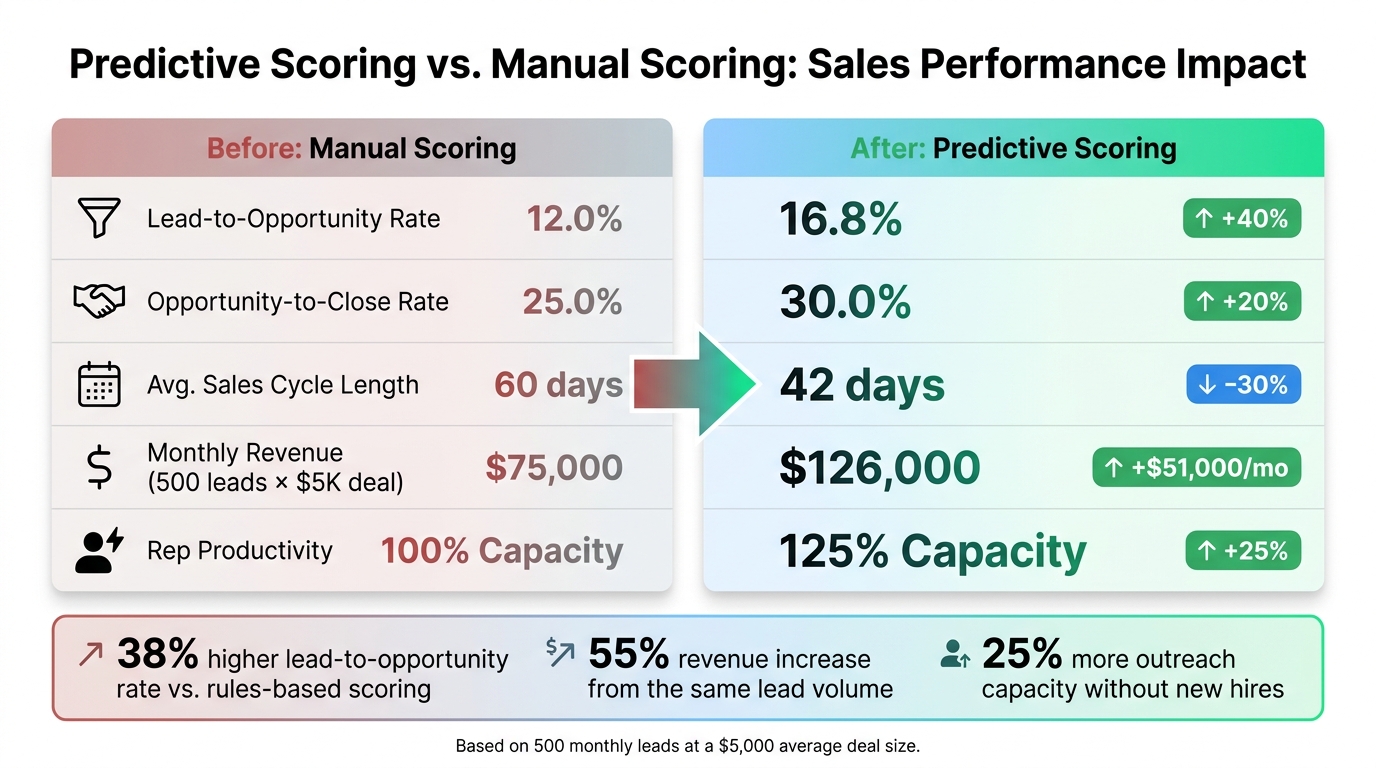
Predictive Scoring vs. Manual Scoring: Before & After Sales Metrics
Sales reps often spend 60% of their time on leads that never convert [8]. That’s a huge drain. Predictive scoring helps shift that time away from weak leads and toward deals with a much better shot of closing.
The payoff is pretty direct: more conversions, less wasted effort, and more revenue per rep hour. It also helps cut the cost per closed deal. You can usually see the change in three places right away: conversion rates, deal costs, and sales speed.
Higher Conversion Rates Through Better Lead Prioritization
Predictive scoring helps teams zero in on the top 20% of leads that drive roughly 80% of conversions [8]. Instead of treating every lead the same, reps can spend more time on accounts that show actual buying intent.
Companies using AI-powered scoring report a 38% higher lead-to-opportunity conversion rate than teams using rules-based methods [6]. Why? Because predictive models weigh stronger buying signals more heavily. For example, a pricing-page visit after someone reads multiple case studies means a lot more than simple pageview volume [8].
There’s also an account-level pattern that many teams miss. When one contact converts, other contacts at that same account convert 3–5x more often [8]. Predictive models pick up these patterns, while manual scoring often doesn’t.
Lower CAC and Shorter Sales Cycles
When reps waste less time on cold leads, acquisition costs can drop. Fewer low-intent calls, emails, and meetings means less effort spent going nowhere.
Speed matters too. If a high-scoring lead triggers an instant CRM alert, a rep can respond in minutes instead of days. And that gap matters more than most teams think. A 5-minute response can multiply conversion odds compared with a 30-minute delay and help move deals through the pipeline faster [3].
"The biggest ROI driver isn’t just more conversions – it’s faster conversions. A 30% shorter sales cycle means you recognize revenue 30% sooner." – Lucas Correia, CEO & Founder, BizAI [3]
AI-driven prioritization can also help teams do more with the same headcount. Sales teams using predictive scoring can increase outreach capacity by 25% without new hires [3]. That means the same lead volume can produce more revenue, with less rep waste and a lower cost per closed deal.
Before-and-After Sales Metrics Comparison
The table below shows what that shift can look like for a team handling 500 leads per month with a $5,000 average deal size [3].
| Metric | Pre-Scoring (Manual) | Post-Scoring (Predictive) | Change |
|---|---|---|---|
| Lead-to-Opportunity Rate | 12.0% | 16.8% | +40% |
| Opportunity-to-Close Rate | 25.0% | 30.0% | +20% |
| Avg. Sales Cycle Length | 60 days | 42 days | −30% |
| Monthly Revenue | $75,000 | $126,000 | +$51,000/mo |
| Rep Productivity | 100% Capacity | 125% Capacity | +25% |
Based on 500 monthly leads at a $5,000 average deal size. [3]
How to Calculate Predictive Scoring ROI Step by Step
Metric changes only hold up when they come from your own CRM data. That baseline lets you turn predictive scoring lift into dollars: more revenue, lower labor waste, and a clear payback window.
Set a Baseline Using 6 to 12 Months of CRM Data
Pull 6 to 12 months of historical CRM data to build your baseline [6][4]. In most cases, models need at least 200 to 500 closed-won opportunities from that period to train well [6][5].
Here’s what to collect:
| Baseline Input Category | Specific Metrics to Collect (Last 6–12 Months) |
|---|---|
| Funnel Volume | Total monthly inbound leads, MQL volume, SQL volume |
| Conversion Rates | MQL→SQL rate, SQL→Pipeline rate, Win rate (Opportunity→Close) |
| Deal Economics | Average deal size (ACV), average gross margin % |
| Sales Velocity | Average sales cycle length (days from creation to close) |
| Sales Capacity | Number of reps (SDRs/AEs), touches per day, fully loaded hourly cost |
| Current Costs | Current customer acquisition cost (CAC), existing software spend |
You should also measure how much rep time goes to low-propensity leads. In manual systems, that’s often around 40% [9]. That figure gives you a clean benchmark for efficiency gains.
Calculate Revenue Uplift, Cost Savings, and Payback Period
Once the baseline is in place, calculate impact in three buckets: revenue lift, productivity savings, and payback. Keep the cost side honest. That means adding everything tied to the project, including software subscriptions, data enrichment, integration work, internal ops time, and training [4].
| Component | Formula |
|---|---|
| Baseline monthly revenue | Monthly qualified leads × stage conversion rate × average deal value [3][10] |
| Incremental revenue | (New monthly conversions − Baseline monthly conversions) × average deal value [3][10] |
| Productivity savings | Hours saved on low-propensity leads × fully loaded hourly cost [4] |
| ROI % | ((Incremental Revenue + Productivity Savings − Total Costs) / Total Costs) × 100 [4][10] |
| Payback period | Total implementation and software costs ÷ monthly net gain [10] |
This is the part sales leaders care about most. If conversions go up and reps spend less time chasing weak leads, the model starts paying for itself. If you skip cost items, though, the math can get shaky fast.
ROI Calculation Template for Sales Leaders
Use this template with your own CRM numbers:
| Input / Output | Formula |
|---|---|
| Baseline monthly revenue | Monthly qualified leads × stage conversion rate × average deal value [3][10] |
| Incremental revenue | (New monthly conversions − Baseline monthly conversions) × average deal value [3][10] |
| Productivity savings | Hours saved on low-propensity leads × fully loaded hourly cost [4] |
| Total costs | Software, data enrichment, integrations, modeling, governance, training, and monitoring [4] |
| ROI % | ((Incremental Revenue + Productivity Savings − Total Costs) / Total Costs) × 100 [4][10] |
| Payback period | Total implementation and software costs ÷ monthly net gain [10] |
How to Set Up Predictive Scoring in Your CRM
Real ROI comes down to three things: clean data, score-based automation, and shared sales-marketing definitions. That order matters. Data quality shapes model accuracy. Routing shapes response speed. Shared thresholds shape team buy-in.
Start With Clean Data and Reliable Lead Signals
Before scoring can move ROI, your CRM needs to send the model clean, complete signals. Incomplete firmographic data can cut score accuracy by 27% [7]. If fields like industry, company size, or acquisition channel are missing, score quality starts slipping before launch. And when scores get weaker, conversion lift usually follows.
Set aside 4 to 6 weeks for CRM cleanup before turning on any model [11][12]. Aim for 70% field coverage for industry, company size, and acquisition channel [11].
Your model also needs more than firmographics alone. It should pull from four signal types [2][7]:
- Firmographic data
- Behavioral signals like page visits and content downloads
- Intent signals like third-party research activity
- Engagement signals like email replies and meeting attendance
Negative signals matter too. Think competitor employees, student email domains, and leads that haven’t engaged for 60+ days. Those inputs help the model learn what sales shouldn’t spend time on [7].
CRM Copilot.AI‘s real-time data verification and CRM integrations with Salesforce, HubSpot, and Zoho can help keep records up to date and cut down on manual cleanup before scoring starts.
Once your data is in good shape, the next step is simple: make sure scores trigger action right away.
Connect Scores to Routing, Follow-Up, and CRM Automation
Clean data only matters if scores lead to action. A score by itself doesn’t do much.
Each score tier should map to a clear CRM action. Faster follow-up and tighter routing can cut wasted rep time and improve conversion. Here’s a practical starting point:
| Lead Tier | Score Range | CRM Action | Response SLA |
|---|---|---|---|
| Tier A | Top 5–10% | Instant SDR alert + auto-booking option | < 5 minutes |
| Tier B | Top 15–25% | Personalized 1:1 outreach sequence | 30–60 minutes |
| Tier C | Mid-range | Marketing nurture + SDR nudges on new intent | N/A (automated) |
| Tier D | Lowest scores | Suppress from sales; recycle to nurture | N/A |
Go one step further and automate a short lead brief inside the CRM for Tier A and Tier B leads. This should tell the rep why the lead scored high, such as pages visited, content downloaded, and a suggested outreach angle [2][12]. Reps move faster when they get context instead of just a number.
CRM Copilot.AI‘s automated CRM workflows and multi-channel engagement features can help run score-based follow-up across email and LinkedIn.
Align Sales and Marketing on Score Thresholds
Automation works much better when sales and marketing agree on what each score means. Predictive scoring tends to stall when each team uses a different lead definition.
Before go-live, both teams should agree in writing on:
- what score range counts as an MQL
- what score triggers SQL status
- how fast sales should respond to each tier
"SDRs will not trust a black-box score. Show them why each lead is scored the way it is. The best AI scoring products surface the top three reasons a lead scored high, in plain English." – Lautaro Schiaffino, Darwin AI [12]
Run a monthly calibration meeting where sales and marketing review tier conversion rates and SLA adherence together [2]. This keeps MQL and SQL reporting honest and makes ROI math easier to trust. If Tier A leads aren’t converting at the rate you expected, that’s the place to spot it and adjust thresholds before the issue gets bigger.
How to Track, Improve, and Scale ROI Over Time
Track the KPIs That Reflect Real ROI
Once routing is live, the goal is simple: measure whether predictive scoring changes revenue, not just activity. A busy sales team can still waste time if reps are working the wrong leads.
Focus on metrics that show where money is moving:
- Lead quality
- Pipeline creation
- Revenue per qualified lead
- Win rate
- CAC by segment
- Rep efficiency, measured as qualified leads worked per rep per week
These numbers tell you whether scoring is pushing rep time toward the right accounts.
Keep reviews on a fixed cadence so scores stay tied to pipeline results. Weekly, audit top-scoring leads that don’t convert and check SLA compliance. Monthly, review tier conversion rates and adjust thresholds. Quarterly, retrain the model and reset targets [2][3][5].
Improve Model Accuracy With Better Data and Workflow Updates
Predictive scoring isn’t a one-and-done setup. Models can weaken when buyer behavior changes or your ICP shifts. Quarterly retraining helps prevent drift. If more leads start landing in Tier A without a matching jump in conversion, that’s a red flag. Go back to your monthly review, revisit thresholds, and compare conversion rates across tiers [3][5].
During the first 30 days after launch, ask reps to flag whether "hot" leads were actually qualified. That feedback goes straight into model tuning.
"Trust flourishes when reps feel the difference: fewer dead ends, faster conversations, clearer ‘why now.’" – Ameya Deshmukh, Author, EverWorker [2]
If lift holds, scale in phases instead of rolling it out everywhere at once. Validate measurable lift in 6–12 weeks and ROI within one to two quarters [4][3]. Use a phased rollout only after conversion lift is steady, adoption is high, and SLA compliance holds. A simple setup works well here: one group uses predictive routing and a control group does not. That gives you clean proof of lift before full-scale expansion [4].
Conclusion: The Link Between Predictive Scoring and Sales ROI
Predictive scoring improves sales ROI by steering rep time toward leads most likely to convert. Organizations using it have reached a 31% conversion rate compared with 20% before implementation, which led to a 55% revenue increase from the same lead volume [1].
That return doesn’t maintain itself. It depends on clean CRM data, score-based automation, and steady model updates that keep up with market shifts. That’s the kind of work CRM Copilot.AI is built to support through real-time data verification, automated CRM workflows, and integrations with Salesforce, HubSpot, and Zoho.
"The score is not the conversion lever. Changed rep behavior is." – The Apollo Team [1]
The teams that get the most from predictive scoring treat it like a living system, not a switch they flip on. They track baseline metrics, measure uplift, review results each month, and retrain each quarter. That’s how a good model keeps producing revenue gains over time.
FAQs
How much CRM data do I need to start predictive scoring?
You usually need 200–500 closed-won opportunities before predictive scoring starts to make sense. If you have fewer than 200 deals, the scores are often too noisy to beat a simple rules-based setup.
Data quality matters just as much as deal volume. Aim for steady, consistent data across at least 15 fields, along with clear closed-won and closed-lost records. Clean, complete data makes the scores more reliable.
What if my CRM data is incomplete or outdated?
Incomplete or outdated CRM data can drag down AI lead scoring accuracy because the model leans on past data. Put simply: garbage in, garbage out.
Start with a data quality audit. Look for duplicates, missing fields, and stale records. CRM Copilot.AI can help verify and update contact and company data in real time. And data enrichment can fill in gaps like firmographic and demographic details.
How soon can predictive scoring show ROI?
Most teams see an early performance lift within 6 to 12 weeks when they use a controlled rollout. Confirming full ROI usually takes one to two quarters, depending on the length of the sales cycle and the number of deals moving through the pipeline.
There’s often an early stretch focused on data cleanup and model tuning. Even so, pipeline efficiency can start improving not long after. A lot comes down to clean historical data, because the system learns from past conversion outcomes.