
AI in sales can boost revenue, productivity, and cost savings – but only if you measure its ROI effectively. Start by setting pre-AI benchmarks, tracking metrics like revenue per rep, sales cycle length, and lead conversion rates. Use tools like CRM integrations to automate data collection and focus on both early indicators (e.g., adoption rates, time saved) and long-term financial outcomes (e.g., win rates, revenue growth). Regularly review performance, compare against industry benchmarks, and refine strategies to ensure your AI investment delivers measurable results. With proper tracking, AI can transform sales operations and drive significant returns.
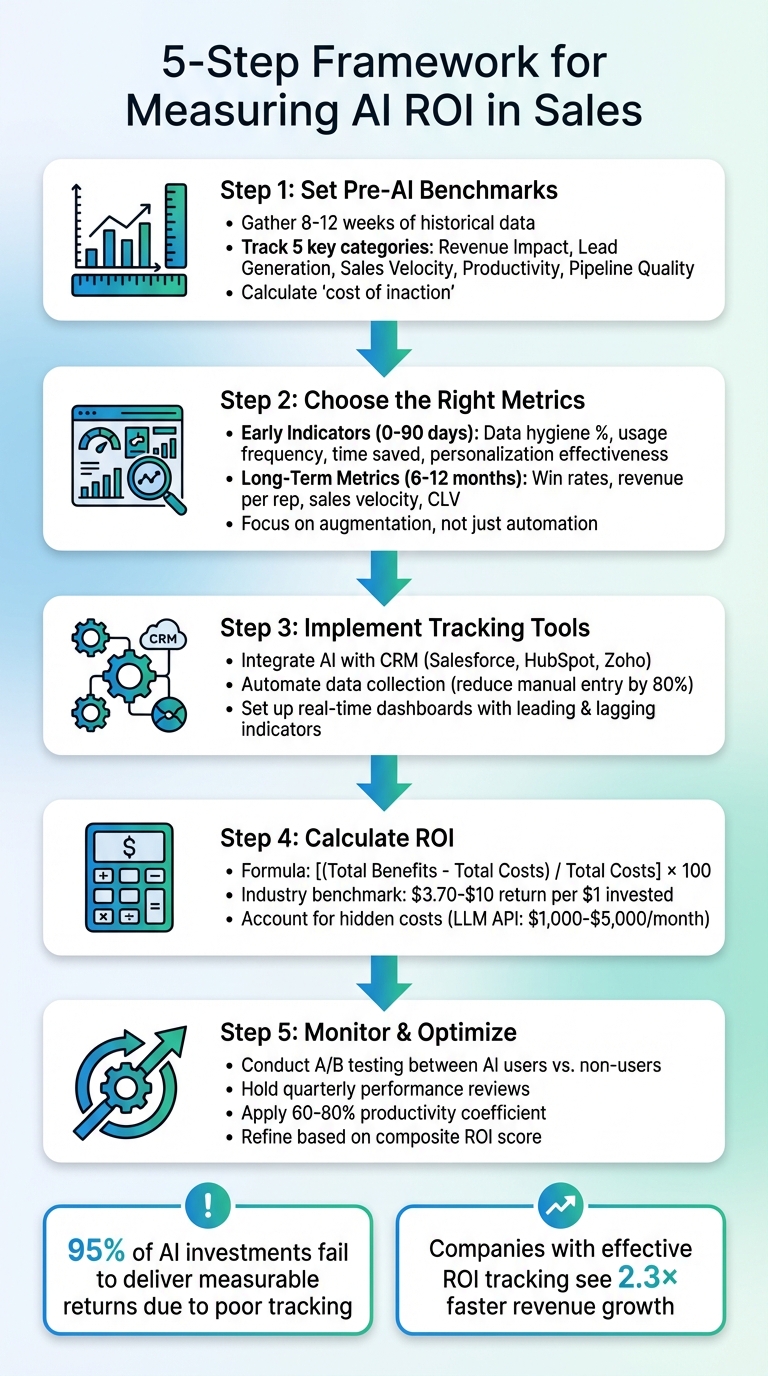
5-Step Framework for Measuring AI ROI in Sales
Measuring AI Success: Beyond Technical Metrics
sbb-itb-0ae5139
Set Pre-AI Performance Benchmarks
Before diving into AI implementation, it’s crucial to establish a baseline that reflects your current performance. This step ensures you can clearly identify AI’s impact and separate its influence from other variables like seasonal trends or shifts in team dynamics [1]. A solid pre-AI benchmark lays the groundwork for accurately measuring ROI later on.
According to Gartner, nearly 30% of AI projects will be abandoned by 2025 after the proof-of-concept stage, often because teams fail to demonstrate clear, measurable outcomes [1]. The problem isn’t AI itself – it’s that many organizations skip the essential step of benchmarking. By documenting your starting point, you can build a compelling case for AI’s value and set clear goals for improvement.
To establish a reliable baseline, gather 8–12 weeks of historical data before introducing AI [3]. This time frame accounts for normal business fluctuations, providing a stable foundation for comparison.
When setting benchmarks, focus on both hard metrics like revenue and win rates and soft indicators such as time saved on manual tasks or lead response times. Hard metrics tie directly to financial outcomes, while soft metrics reveal how AI frees up capacity for higher-value activities.
Metrics to Track Before AI
Start with five key performance categories to ensure a comprehensive view of your operations. These metrics will help you assess AI’s impact across revenue, efficiency, and productivity:
- Revenue Impact: Track win rates, average deal sizes, and revenue per sales rep. These numbers directly link AI investments to measurable business outcomes and form the backbone of your ROI calculation.
- Lead Generation Efficiency: Monitor your website’s visitor-to-lead conversion rate and cost per lead (CPL). If AI improves targeting, you should see CPL decrease while conversions increase.
- Sales Velocity: Keep an eye on metrics like sales cycle length and lead-to-meeting conversion rates. These indicators show whether AI is helping deals move faster through your pipeline [1].
- Productivity: Document how much time your team spends on administrative tasks like lead qualification, email verification, and data entry. Also, track average response times to buyer inquiries and how long it takes to ramp up new hires.
- Pipeline Quality: Measure the percentage of accounts that meet your ideal customer profile (ICP) and evaluate your current forecast accuracy. This will help you determine if AI is improving precision in targeting, not just increasing lead volume.
| Metric Category | Specific KPIs to Document | Why It Matters |
|---|---|---|
| Revenue Impact | Win rate, average deal size, revenue per rep | Shows if AI drives measurable business results |
| Lead Generation | Visitor-to-lead conversion, cost per lead (CPL) | Tracks improvements in top-of-funnel efficiency |
| Sales Velocity | Sales cycle length, lead-to-meeting conversion | Measures acceleration of deals through the pipeline |
| Productivity | Hours on admin tasks, response time, ramp time | Quantifies time saved for high-value selling activities |
| Pipeline Quality | Percentage of qualified accounts, forecast precision | Evaluates targeting accuracy and predictability |
Tools for Collecting Baseline Data
To ensure your benchmarks are accurate, rely on tools that can automate and streamline data collection. Your CRM system is a great starting point. Platforms like CRM Copilot.AI integrate seamlessly with tools like Salesforce, HubSpot, and Zoho, tracking metrics such as lead activity, data quality, and engagement patterns without requiring manual input.
Before rolling out AI, make sure your data quality is up to par. Inaccurate or incomplete data can undermine AI performance [5]. Check for duplicate contacts, missing email addresses, or outdated job titles in your CRM. Clean, well-structured data ensures that your baseline metrics are meaningful and that AI tools can deliver reliable insights.
Finally, calculate the "cost of inaction." Quantify the revenue lost due to slow response times, poor lead qualification, or excessive time spent on admin tasks [6]. Framing these inefficiencies as missed opportunities strengthens your case for AI, positioning it as a strategic necessity rather than just an optional upgrade.
Choose the Right ROI Metrics for AI in Sales
When it comes to measuring the success of AI in sales, not all metrics are created equal. Some provide quick insights into progress (early indicators), while others reveal longer-term financial benefits. This distinction is crucial because a staggering 95% of AI investments fail to deliver measurable returns – often due to focusing on the wrong metrics at the wrong time [3]. Using your pre-AI benchmarks as a foundation, these metrics can help pinpoint where AI is making an impact.
Early indicators act as "soft signals", highlighting behavioral shifts and process improvements before deals close. On the other hand, long-term metrics focus on financial outcomes like revenue growth and win rates [1]. Both types are essential, but they serve different purposes depending on where you are in your AI journey.
A key shift to watch for is moving beyond simple automation to true augmentation. If your AI tool is only automating repetitive tasks, you might be missing the point. As one expert puts it:
"If a tool isn’t actively changing how your sales team thinks, decides, and executes, it’s not augmentation, it’s just expensive automation." [1]
Real ROI comes from AI tools that enhance how people work – improving decision-making, win rates, and alignment with buyers – rather than just saving time on manual tasks. To measure this effectively, your metrics need to capture both efficiency gains and improvements in quality.
Early Indicators of AI Performance
In the first 90 days, focus on adoption and behavioral changes rather than immediate revenue. Early indicators can show whether the AI tool is addressing real challenges and gaining traction with your team. Start by assessing AI preparedness through metrics like:
- Data hygiene: The percentage of clean, structured CRM data.
- System integrations: How many of your go-to-market systems are connected.
- Team readiness: The percentage of staff that has completed AI training [4].
High-quality data is critical for AI to perform at its best.
Next, track usage and engagement. Are team members actively using the tool? Metrics like usage frequency, the number of tasks automated (e.g., meeting summaries or email drafting), and prompt volume can reveal whether the AI is solving immediate problems [4][8]. Low adoption might indicate that the tool isn’t intuitive or well-suited to your workflow.
Productivity and efficiency metrics are another key area. Measure improvements like time saved during lead generation, reduced meeting preparation time, and hours reclaimed from admin tasks [8]. Keep in mind that not all saved time translates into productive work – apply a productivity coefficient of 60–80% to account for this.
Finally, evaluate strategic effectiveness. Metrics such as personalization effectiveness (e.g., higher email response rates), buyer alignment scores, and messaging consistency can help predict whether AI will drive revenue growth over time [1].
| Early Indicator Category | Example Metrics | Why It Matters |
|---|---|---|
| AI Preparedness | Data hygiene %, number of GTM systems integrated, % of team trained | Lays the groundwork for reliable AI performance |
| Usage & Engagement | Usage frequency, number of tasks automated, % adoption of new features | Shows whether the tool addresses real challenges |
| Productivity/Efficiency | Time saved per session, reduction in meeting prep time | Highlights time freed up for higher-value activities |
| Strategic Effectiveness | Personalization effectiveness, buyer alignment score, messaging consistency | Indicates potential for long-term revenue growth |
Don’t overlook qualitative wins either. Increased confidence among reps, better coaching from managers, and reduced burnout are all signs of early AI success – even if they don’t show up on a dashboard yet [4].
Once you’ve confirmed adoption and process improvements, it’s time to shift your focus to financial outcomes.
Long-Term ROI Metrics
After 6–12 months, turn your attention to lagging indicators that demonstrate financial impact. These metrics are critical for justifying your AI investment. As Dmitri Adler, Co-Founder of Data Society, explains:
"The return on investment for data and AI training programs is ultimately measured via productivity… the real ROI can be measured over 12 to 24 months." [9]
One of the most telling long-term metrics is sales velocity – how quickly deals move from the first meeting to a close. Effective AI should shorten this timeline [1]. Similarly, tracking win rates by persona can show whether AI is helping your team close deals with high-fit accounts [1].
Another key metric is revenue per rep – calculated by dividing total revenue by the number of active reps. AI should help scale individual performance, and companies that track AI ROI effectively often see 2.3× higher revenue growth and more than a 30% improvement in win rates [7].
Customer lifetime value (CLV) is also worth monitoring. AI-driven personalization and retention strategies can significantly increase the value of each customer. For instance, AI can reduce churn by up to 55%, while integrating AI into customer experience and ERP systems can deliver a five-year ROI of 214%, with potential gains reaching 761% in optimal scenarios [6].
Additionally, track ramp time reduction – how quickly new hires hit their first quota. Faster ramp times indicate better organizational learning and knowledge sharing [1].
Lastly, measure cost savings from reduced manual work. AI tools can cut overall sales costs by 10–15% and boost average deal sizes by 10–30% [7]. Some companies even report returns of 3× to 6× their investment within the first year of using AI sales agents [7].
Segment your data by adoption level to see how power users compare to those lagging behind [1].
Platforms like CRM Copilot.AI make it easier to track these metrics over time. By integrating directly with your CRM, they automate data collection and provide real-time insights into key areas like win rates, sales velocity, and pipeline quality – eliminating the need for manual reporting.
Use Tools to Track and Monitor ROI
Once you’ve set your benchmarks and metrics, the next step is to implement tools that make tracking ROI seamless. Relying on spreadsheets and disconnected systems can make ROI measurement cumbersome and error-prone. The answer lies not in working harder but in upgrading your tools.
Modern AI platforms simplify this process by embedding ROI tracking into their systems. These tools automatically collect and report relevant data, cutting out the need for manual logging or report creation. With automated monitoring, businesses can clearly see the value AI brings to their operations.
CRM Integration for Real-Time Tracking
After setting up automated tools, integrating them with your CRM ensures real-time data collection. When your AI platform connects directly to systems like Salesforce, HubSpot, or Zoho, it captures behavioral changes and performance metrics without disrupting your team’s workflow[1][12].
For instance, CRM Copilot.AI integrates seamlessly with major CRMs, automating tasks like data capture and verification. Its real-time data verification keeps contact information accurate, while workflows handle lead prioritization and data enrichment. This automation can reduce manual data entry by up to 80%[12], allowing your team to focus on revenue-driving activities.
Every action is automatically logged in your CRM. Whether a rep personalizes an email or prioritizes a lead using AI, the activity is tracked. This makes it easy to compare AI-assisted deals with baseline deals, showing how AI accelerates deal pipelines and improves win rates. Instead of relying on retrospective analysis, you can monitor the impact as it happens.
Financial benefits also become apparent more quickly. Automated platforms translate operational improvements into measurable dollar amounts, turning hours saved into cost savings and removing the guesswork[3]. This clarity helps identify exactly where and how AI is delivering value.
Dashboard KPI Monitoring
Once your CRM is integrated and collecting real-time data, dashboards take over to organize raw metrics into actionable KPIs. A well-designed dashboard balances leading indicators – like usage frequency and automation actions – with lagging indicators such as win rates and revenue growth[5]. This combination allows you to address issues early while also tracking long-term outcomes.
For example, sales teams using CRM Copilot.AI can monitor key metrics directly through their CRM dashboards. Lead prioritization metrics highlight prospects most likely to convert, while engagement rates reveal how personalized outreach compares to generic messaging. Conversion metrics track how AI-assisted deals progress from initial contact to close, making it easy to calculate the revenue gains from AI-supported activities[1].
"AI isn’t magic. It only delivers ROI when it’s properly configured, adopted, embedded into workflows, and tied to measurable outcomes." – Bryan Bayless, VP, Revenue Center of Excellence, Gong[5]
To keep dashboards focused on business goals, consider using a composite ROI score. This score might weigh factors like revenue velocity (40%), productivity gains (30%), strategic effectiveness (20%), and organizational learning (10%)[1]. By consolidating these metrics, executives get a clear, single figure for evaluating investments while still capturing the broader impact of AI.
Schedule regular reviews – monthly for tactical adjustments and quarterly for strategic planning – to stay aligned with stakeholders and address potential issues early[11]. Thanks to automatic data capture and real-time updates, these reviews shift from tedious data-gathering sessions to meaningful discussions about optimization and growth.
Calculate and Compare ROI Against Industry Standards
With real-time metrics available in your dashboard, it’s time to measure the financial impact of your AI initiatives. Using the ROI tracking methods previously discussed, you can now calculate your ROI. The formula is simple: [(Total Benefits – Total Costs) / Total Costs] × 100[13]. This will reveal exactly how much return you’re getting for every dollar invested in your AI sales tools.
Step 1: Identify Total Costs
Start by gathering all costs associated with your AI implementation. These include software licensing fees, integration and setup expenses, employee training, data infrastructure, and ongoing maintenance[10]. Don’t forget hidden costs, such as LLM API usage and prompt tuning, which can range from $1,000 to $5,000 per month[13]. Many organizations underestimate AI implementation costs by 40% to 60%[10], so it’s critical to account for these variables to avoid surprises.
Step 2: Calculate Total Benefits
Next, quantify the benefits. Add up direct revenue gains, such as increased lead conversion rates, and cost savings, like reduced labor hours spent on prospecting[13]. For instance, if your lead conversion improves by 15% and your average deal size is $50,000, multiply that by your total pipeline value to estimate revenue gains. Additionally, include productivity improvements by calculating the hours saved per sales rep and multiplying that by their hourly rate. Once you’ve determined Total Benefits, subtract Total Costs to find your Net Benefits. Then, use the formula to calculate ROI: (Net Benefits / Total Costs) × 100.
Step 3: Compare Against Industry Benchmarks
Once you’ve calculated your ROI, compare it to industry benchmarks. On average, companies report an ROI of $3.70 for every $1 invested in AI, while top performers can achieve up to $10 for every $1 spent. Additionally, organizations adopting AI often see revenue growth between 3% and 15%, alongside sales ROI increases of 10% to 20%[13]. If your ROI falls below these benchmarks, it may indicate a need to refine your AI strategy or workflows.
Real-World Example
Consider this: in 2025, a 3,000-person B2B SaaS company achieved an impressive 1,329% ROI with a 9-month payback period on their $2.1 million annual AI investment. Their 400 developers saved 8 hours per week each, while 200 sales reps saved 3 hours weekly. These time savings translated to productivity gains valued at approximately $23.5 million annually[2]. Examples like this can serve as benchmarks to help you set realistic targets and identify areas for improvement.
Monitor and Optimize Performance Over Time
Once you’ve set benchmarks and chosen the right metrics, the work doesn’t stop there. Continuous optimization is essential to ensure your AI tools keep delivering value. As AI evolves, sales teams adapt, and markets shift, you need to keep measuring ROI. Without regular adjustments, AI risks becoming just another automation tool – a pitfall we’ve touched on earlier.
Many companies use generative AI, but only a few see lasting returns. The difference often lies in how well they track performance and refine their strategies. Businesses that create feedback loops to improve AI models and uncover new applications stay aligned with changing goals and market demands. This ongoing monitoring connects your initial ROI projections to long-term success[6].
A/B Testing for Feature Optimization
A/B testing is a powerful way to evaluate AI’s impact. Split your sales team into two groups: one group (Group A) uses specific AI tools – like CRM Copilot.AI – while the other group (Group B) sticks to your standard processes. Compare their performance over a set period to see how key metrics, like win rates, differ between the two groups[1].
It’s also crucial to track both leading and lagging indicators. Leading indicators, such as how often features are used, adoption rates, or the number of automated tasks completed, can give you an early signal of success before revenue results appear[5]. For instance, you might monitor how frequently your team uses saved searches or automated workflows. Then, compare these engagement metrics with lagging indicators like win rates, average deal sizes, or the length of sales cycles.
Interestingly, teams that fully embrace AI tools often see 2-3 times higher revenue compared to those who don’t[1]. To pinpoint what’s driving success, use cohort analysis to group sales reps by their level of AI adoption. If your top users consistently outperform others, you’ve identified which features deliver the most value. This insight can guide training efforts to elevate the performance of the entire team.
Once you’ve fine-tuned specific features, formal reviews can help ensure your improvements align with broader business objectives.
Quarterly Performance Reviews
Holding quarterly reviews is a great way to track progress and refine your approach[2]. AI tools improve as they process more data, and these regular check-ins create a feedback loop to keep models sharp and maximize value over time[6]. Without these reviews, AI projects can lose momentum, so it’s important to make them a priority[2].
During each review, calculate a composite ROI score based on four key categories: Revenue Velocity Impact (40%), Productivity Amplification (30%), Strategic Effectiveness (20%), and Organizational Learning (10%)[1]. Also, pay attention to how your team is using the time saved by AI tools. For example, when CRM Copilot.AI automates workflows, not all saved time gets spent on high-value activities. Apply a productivity coefficient of 60%-80% to account for this[2]. The real ROI comes when those extra hours are redirected toward strategic activities, like building relationships or pursuing new opportunities.
"AI isn’t magic. It only delivers ROI when it’s properly configured, adopted, embedded into workflows, and tied to measurable outcomes." – Bryan Bayless, VP, Revenue Center of Excellence, Gong[5]
Use these quarterly reviews to test your assumptions. If certain features aren’t producing the results you expected, adjust your strategy. Double down on what works, cut what doesn’t, and ensure your AI investment continues to drive meaningful outcomes.
Conclusion
Measuring the return on investment (ROI) of AI in sales isn’t a one-and-done task – it’s an ongoing process that demands consistency, proper tools, and a focus on continuous refinement. Establishing clear baselines, selecting meaningful metrics, and maintaining diligent tracking are key steps to unlocking AI’s potential. Success begins with laying a solid foundation.
Start by documenting your baseline metrics, including process efficiency, quality, cost, and revenue. Skipping this step can leave organizations navigating without direction – a mistake that has led to 95% of AI investments yielding no measurable returns[3]. These benchmarks act as a compass, guiding every subsequent effort to assess AI’s impact.
Selecting the right metrics is equally important. Use a combination of leading indicators, like feature adoption and usage rates, alongside lagging indicators, such as win rates and deal sizes. Tools like CRM Copilot.AI can streamline this process by integrating with your CRM systems, offering real-time dashboards to track performance shifts. This kind of instant feedback allows you to quickly identify successes and adjust strategies as needed.
Over time, the value of AI grows exponentially. Companies that effectively measure AI ROI experience 2.3x faster revenue growth compared to those relying on outdated methods[7]. Practices like A/B testing, quarterly reviews, and reinvesting time saved into higher-value activities ensure that AI becomes a long-term driver of revenue growth. AI delivers results when it is thoughtfully implemented, embraced by teams, embedded into workflows, and tied to clear, measurable outcomes[5].
FAQs
How can I establish effective benchmarks before implementing AI in sales?
To create effective pre-AI benchmarks, start by pinpointing the key sales metrics you want to track. These could include qualified leads per month, conversion rates, or the average length of your sales cycle. Pull historical data from your CRM – like Salesforce or HubSpot – covering the last 3–6 months to establish a reliable baseline. Make sure the data is consistent by normalizing factors like timeframes, territories, and calculations. This step helps avoid skewed results from seasonal trends or reporting differences.
Once you have your baseline, set realistic improvement goals. For example, aim for a 15% reduction in your sales cycle length or a 10–20% boost in lead volume. Document these benchmarks and review them with your key stakeholders, such as sales leadership and finance teams, to ensure they align with your broader business goals. Finally, lock in these baseline metrics on the day you activate your AI tool – like CRM Copilot.AI – so you can make accurate before-and-after comparisons. This clear and structured process will help you measure the impact of AI on your sales performance.
What metrics should you track to measure the ROI of AI in sales?
To gauge the ROI of AI in sales, it’s important to focus on metrics that highlight both performance and efficiency improvements. Start by keeping an eye on conversion rates at each stage of the sales funnel, average sales cycle duration, and the balance between customer acquisition cost (CAC) and customer lifetime value (CLV). These numbers paint a clear picture of how well your sales process is working.
You should also track time saved per sales representative, pipeline growth or revenue increases, and better response rates from outreach campaigns. These metrics reveal how AI tools are streamlining workflows and boosting results.
For insights specific to AI’s impact, look at lead-scoring accuracy and engagement rates with AI-driven tools. These figures show how effectively AI is enhancing decision-making and overall sales productivity.
How can I make sure my AI tools provide long-term financial value?
To make sure your AI-powered lead generation tools consistently deliver financial returns, start by tying them to specific business goals. These might include cutting customer acquisition costs, speeding up sales cycles, or boosting the number of sales-ready leads. Use a straightforward ROI formula to evaluate their performance: (Revenue gains + Cost savings + Productivity improvements – Implementation costs) ÷ Total investment. This gives you a clear way to measure whether the tools are providing real value.
It’s also crucial to set up a system for tracking key metrics. Keep an eye on both leading and lagging indicators, such as user adoption rates, the volume of automated outreach, cost per lead, conversion rates, and overall revenue growth. Compare these numbers regularly to your performance before implementing AI, and tweak your strategies if needed. Reviewing results on a quarterly basis ensures your tools stay aligned with your business goals.
Tools like CRM Copilot.AI can make this process much easier. By integrating with popular CRMs like Salesforce, HubSpot, and Zoho, it offers features like real-time data verification and automated workflows. These capabilities help sales teams maintain top-notch lead quality, streamline operations, and achieve sustained ROI over time.